Statistics open the screen. Advanced Statistics Select the period you want to review in the section; read abstract cards, graphics and detailed records in the same context.

Select period and filters

Date range, Grouping, Filter

1. Date range

Set the period with ready interval or calendar.

2. Grouping

Daily or monthly calculation.

3. Filter

The situation applies the payment API, amount and user criteria.
Filters Open the top area with the button. Set the date range from calendar or use ready ranges like today, yesterday, this month. You can take the previous or later period with arrows. Daily / Monthly selection changes time grouping of graph. Status, payment API, the lowest/en high amount, and fill and fill the user areas Filter Press the button. Reset returns to the starting scope. Selected data to get printable report Export PDF Use the button; check the specified line limit on the output.

Compare abstract cards

Success Rate, Sales Amount, Total Revenue

1. Success Rate

Percentage of success of transactions.

2. Sales Amount

Also follow the amount of product purchases.

3. Total Revenue

Total of income from selected period.
Total Revenue, Total Transaction, Success Rate, Return Rate, Sales Amount and Purchasing different sizes. Evaluate the amounts, quantities and percentages with their own titles. Comparison badges vary according to previous term. The average transaction at the bottom sums includes new user, highest day, registration/input and support information. If a data is not provided on your installation, it can be shown as a line; do not read it in the same sense as zero registration.

Monitor change in the chart

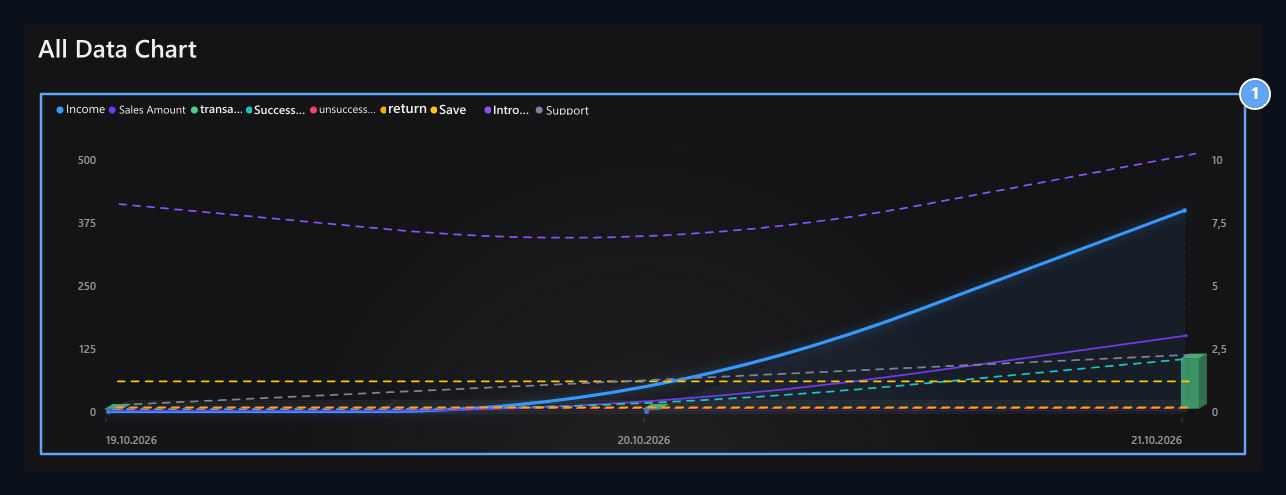
All Data Graph

1. All Data Chart

Check out the income, transaction, registration, login and support series together.
All Data Graph income, sales, transaction, status, registration, input and support series display in time. Find Lejanttan series. When you change the period or grouping, review the chart with new scope; the units of the transaction are different with the amount of income.

View on user basis

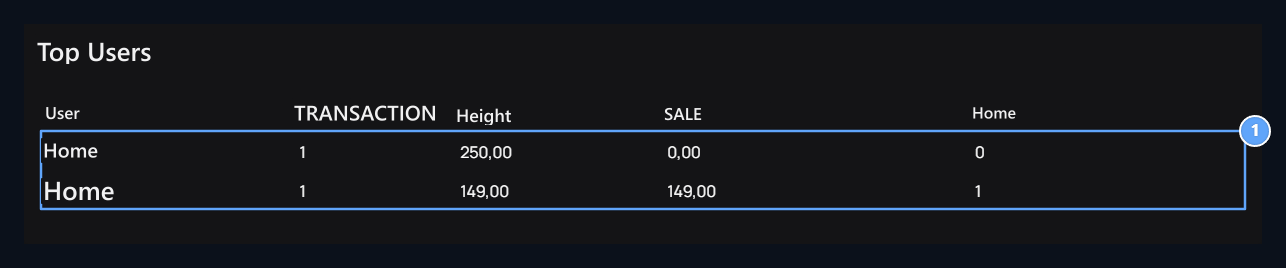
Top Users

1. Top Users

Transaction, income and purchase columns are shown on the user basis.
Top Users Compare the number of transactions on the table, total amount, sales amount and purchase ade. Do not remove the total shopping result by looking at the single column because the product purchase is different movements.

Read monthly report

Monthly Report

1. Monthly Report

Read successful, unsuccessful, return and sales amounts on the term basis.
Read each month with successful, unsuccessful and return numbers; income, sales amount and purchase. If there is no registration from a kind of time you filter, the corresponding value may appear zero.

Find the detail of the transaction

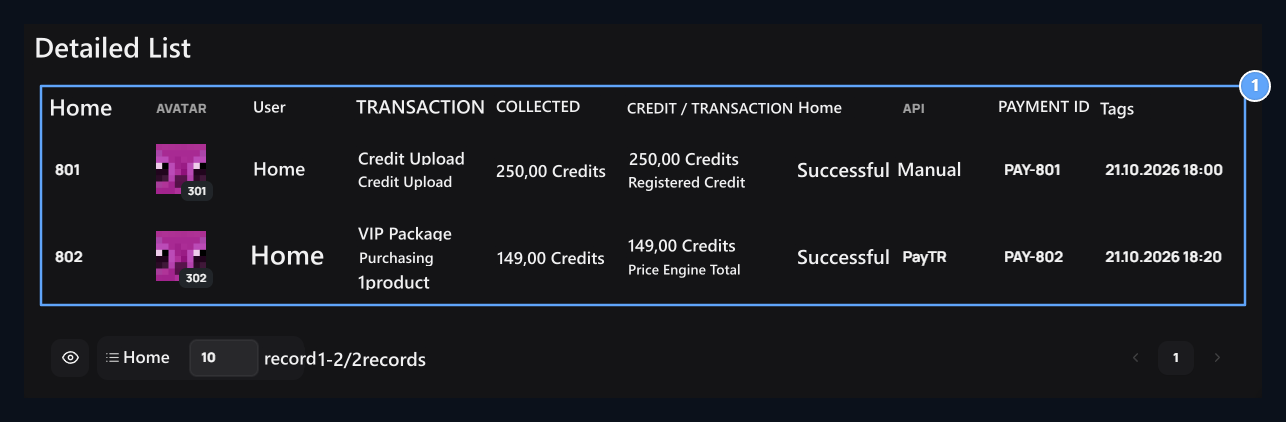
Detailed List

1. Detailed List

Check the user, transaction, amount, status, API and payment record together.
Detailed List the user combines transaction, amount, credit, status, API, payment ID and date information. If you have products, variant, additional service, commission and tax/net details, check out their own fields. Payment ID when searching a record Payments Register on the screen, also information on the product Orders match with.