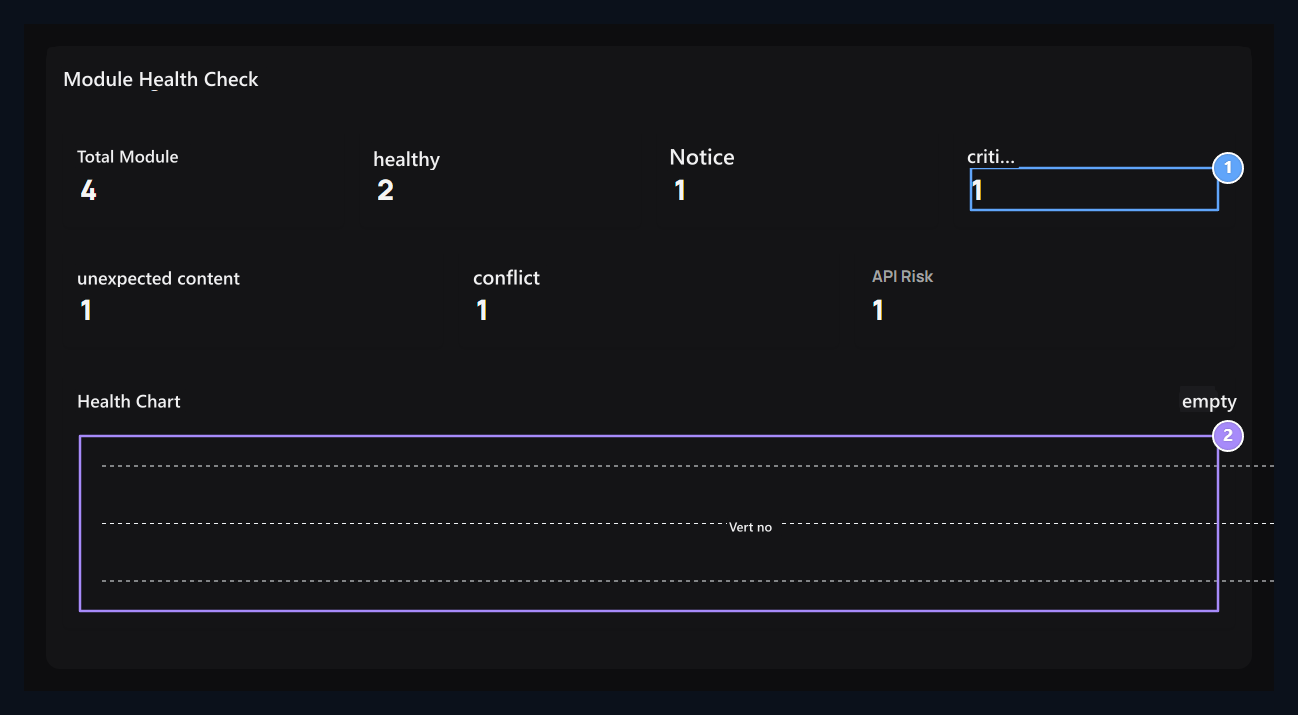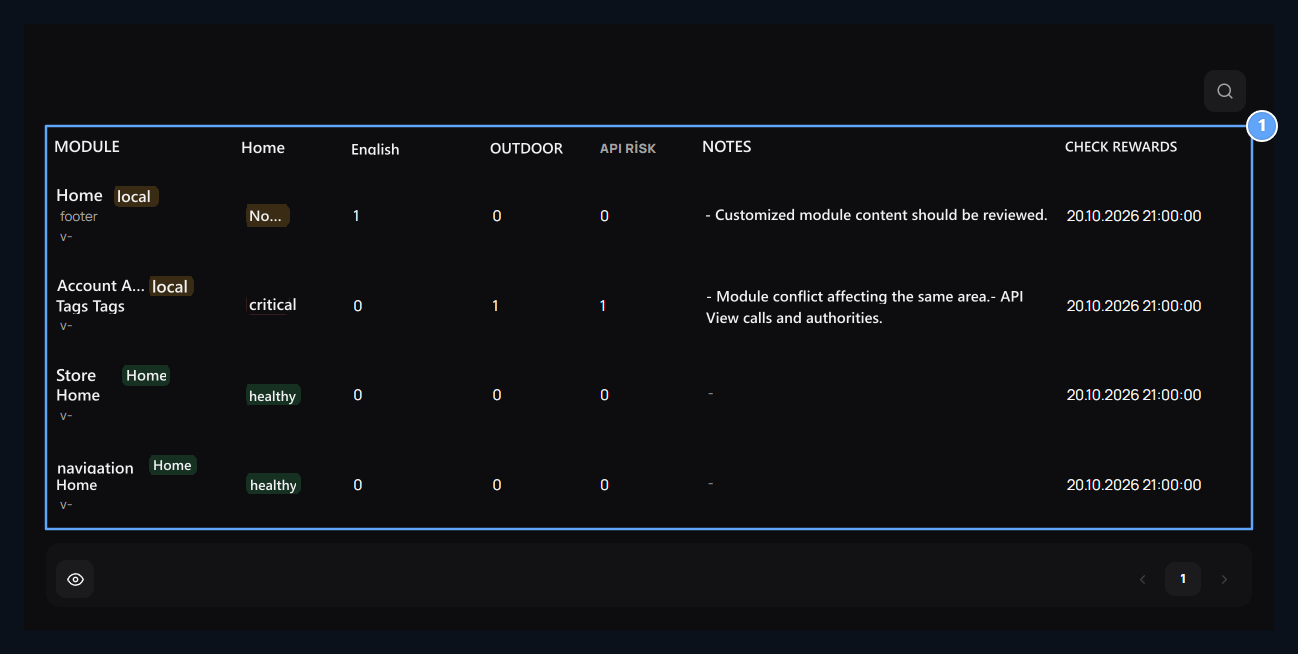
Health Check open the screen. See the summary status of modules, then check the details of the alert or critical line.

Read summary indicators

Critical modules, Health distribution

1. Critical modules

First, examine the notes and corresponding module of critical records.

2. Health distribution

Follow the distribution of healthy, alert and critical records.
Total Moduleshows the number of modules monitored. Healthy, Warning and critical values give status distribution. First, see the notes of critical situations; then evaluate alerts. Unforgettable Content, Jam and API Risk The counters are separate findings. Do not calculate a new module sum by collecting them with the number of situations. Read the chart in the same control period.

View Module detail

Detailed control

1. Detailed control

Read the unfortable content, conflict, API risk and control time together.
Module and Local / Cloud Find out about. With unfortable content, conflict and API risk columns Notes and Updated / control time Read the information. You can narrow down the module related to the search area. Open the module’s own screen or connection adjustment according to the specified problem. This page is for review; no automatic repair button. Rate if table is idle, the control data is formed and not formed; do not accept the blank list as a healthy result. For connection and configuration research Addons, API Keys and Pasts Use guides.